# 1. 載入 ggplot2 繪圖套件
library(ggplot2)

# 2. 模擬生成三組患者的血糖降低值數據 (mg/dL)
set.seed(55)
drug_a <- rnorm(10, mean = 25, sd = 6)  # 藥物 A
drug_b <- rnorm(10, mean = 35, sd = 5)  # 藥物 B (預期效果最好)
drug_c <- rnorm(10, mean = 18, sd = 7)  # 藥物 C (預期效果較差)

df_anova <- data.frame(
  Drug = factor(c(rep("藥物 A (Drug A)", 10), rep("藥物 B (Drug B)", 10), rep("藥物 C (Drug C)", 10))),
  GlucoseReduction = c(drug_a, drug_b, drug_c)
)

# =======================================================
# 實作一:變異數同質性檢定 (Bartlett's Test)
# =======================================================
# ANOVA 前提診斷:p > 0.05 代表滿足變異數同質性
bartlett_res <- bartlett.test(GlucoseReduction ~ Drug, data = df_anova)

# =======================================================
# 實作二:執行單因子變異數分析 (One-Way ANOVA)
# =======================================================
# aov() 是 R 中進行變異數分析的函數
anova_model <- aov(GlucoseReduction ~ Drug, data = df_anova)
anova_summary <- summary(anova_model)

# =======================================================
# 實作三:執行 Tukey's HSD 事後多重比較
# =======================================================
tukey_res <- TukeyHSD(anova_model)

# 輸出統計結果
cat("=========================================\n")
cat(" 實作一:變異數同質性檢定結果\n")
cat("=========================================\n")
print(bartlett_res)

cat("\n=========================================\n")
cat(" 實作二:單因子變異數分析 (ANOVA) 結果\n")
cat("=========================================\n")
print(anova_summary)

cat("\n=========================================\n")
cat(" 實作三:Tukey's HSD 事後比較結果\n")
cat("=========================================\n")
print(tukey_res)

# =======================================================
# 4. 使用 ggplot2 繪製箱形圖並重疊個體數據點 (Jitter)
# =======================================================
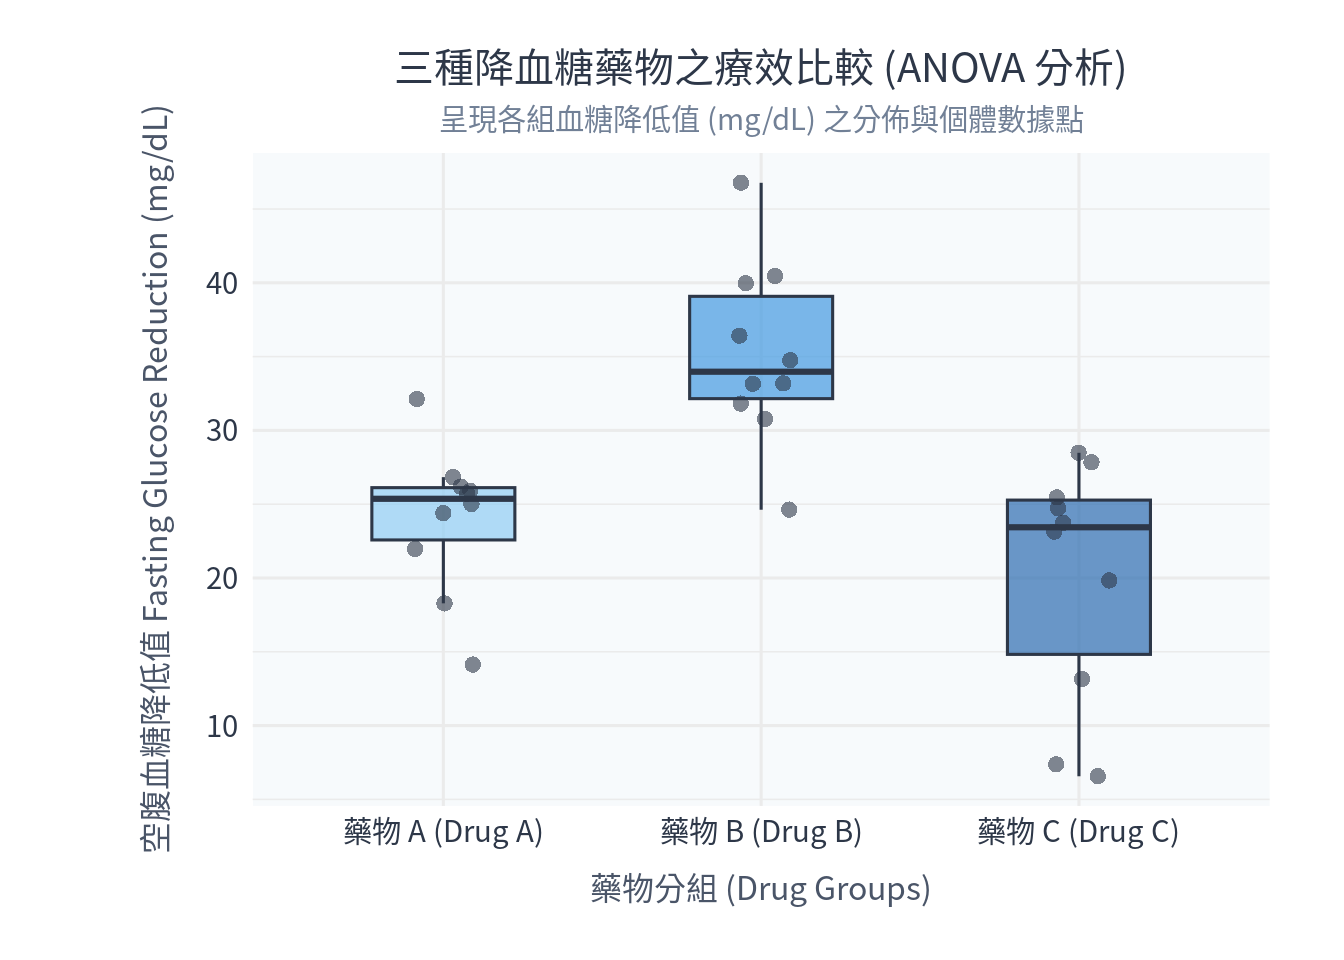
p_anova <- ggplot(df_anova, aes(x = Drug, y = GlucoseReduction, fill = Drug)) +
  # 畫箱形圖 (隱藏預設離群值,改由隨機抖動點呈現)
  geom_boxplot(alpha = 0.7, color = "#2d3748", outlier.shape = NA, width = 0.45) +
  # 疊加個人數據散佈點
  geom_jitter(shape = 16, width = 0.1, size = 2.5, color = "#2d3748", alpha = 0.6) +
  scale_fill_manual(values = c("藥物 A (Drug A)" = "#90cdf4",
                               "藥物 B (Drug B)" = "#4299e1",
                               "藥物 C (Drug C)" = "#2b6cb0")) +
  labs(
    title = "三種降血糖藥物之療效比較 (ANOVA 分析)",
    subtitle = "呈現各組血糖降低值 (mg/dL) 之分佈與個體數據點",
    x = "藥物分組 (Drug Groups)",
    y = "空腹血糖降低值 Fasting Glucose Reduction (mg/dL)"
  ) +
  theme_minimal(base_family = "Noto Sans CJK TC", base_size = 12) + # Windows 請替換為 Microsoft JhengHei
  theme(
    plot.title = element_text(size = 15, hjust = 0.5, color = "#2d3748", lineheight = 1.1),
    plot.subtitle = element_text(size = 11, hjust = 0.5, color = "#718096"),
    axis.title = element_text(size = 12, color = "#4a5568"),
    axis.title.x = element_text(margin = margin(t = 10)),
    axis.title.y = element_text(margin = margin(r = 12)),
    axis.text = element_text(size = 11, color = "#2d3748"),
    legend.position = "none", # x 軸已有分組標記,圖例可隱藏
    panel.background = element_rect(fill = "#f7fafc", color = NA),
    plot.background = element_rect(fill = "white", color = NA),
    plot.margin = margin(20, 28, 20, 54)
  )

# 顯示圖檔
print(p_anova)